Data Analysis & Science
Much of the science I have performed has focused on analyzing large data sets and using the analysis to describe an issue or make a prediction. For more on my data analysis and science experience, see the examples below.
Predicting Seasonal Tropical Cyclone Formation

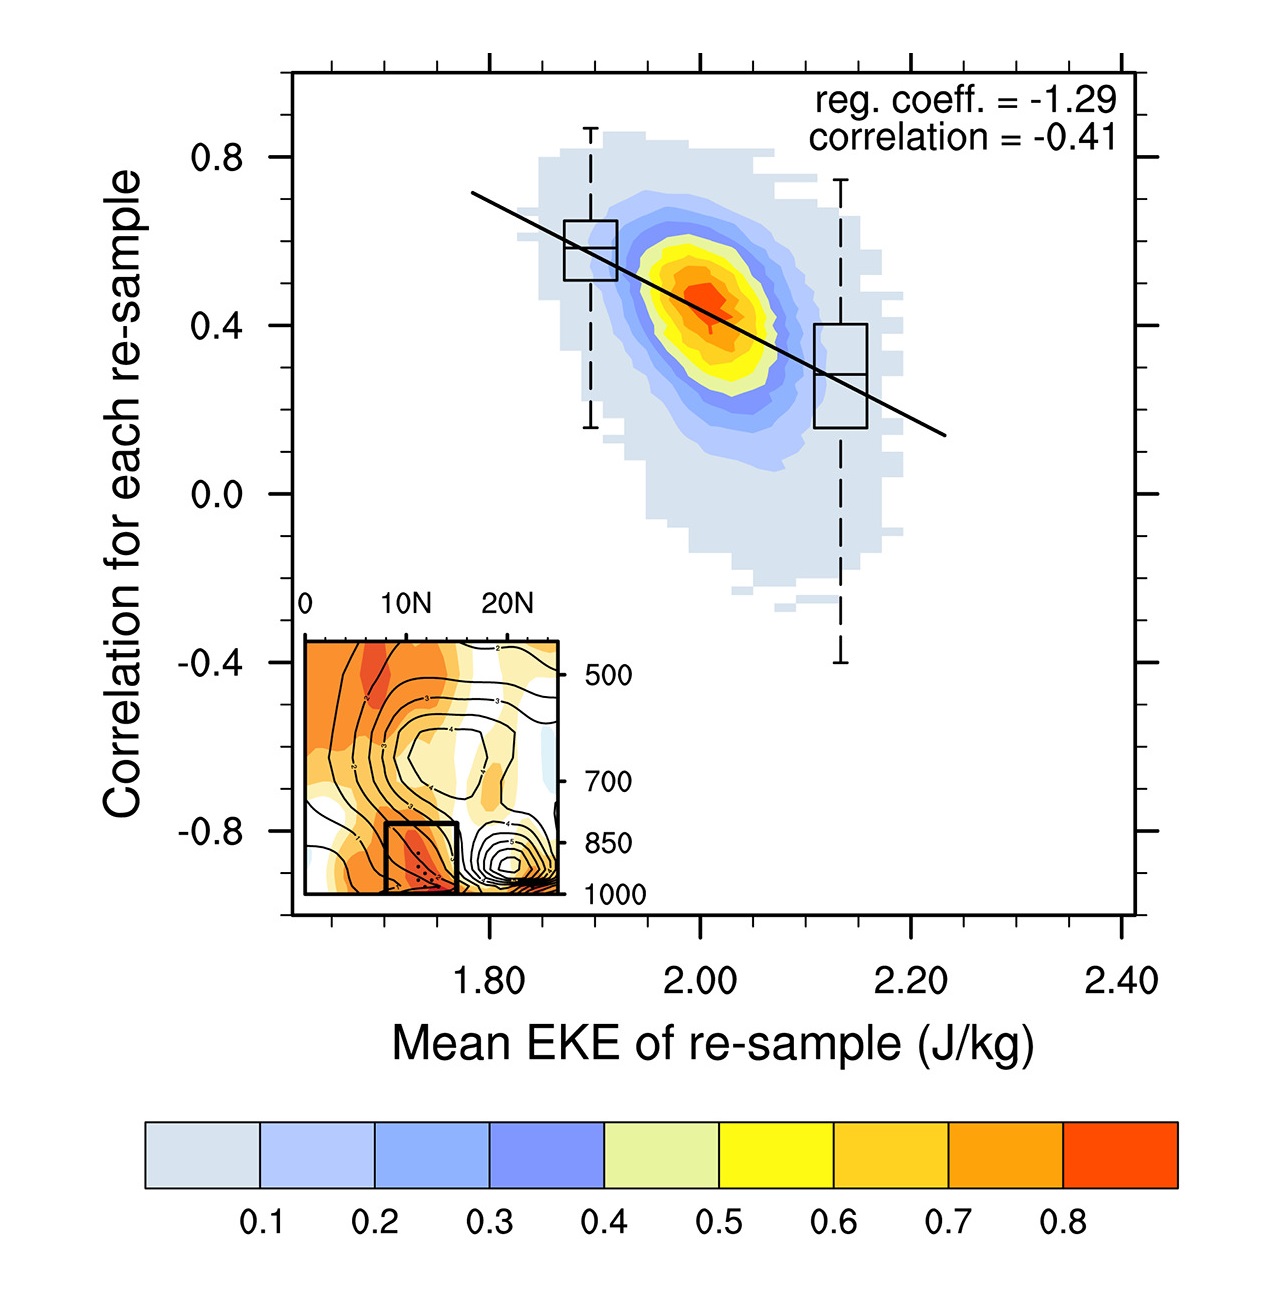
The graphic represents a study examining the seasonal relationship between African Easterly Waves (AEWs) and the formation of tropical cyclones (TCs) in the Atlantic.
In this study, I showed that there is a statistically significant correlation between the low-level energy associated with AEWs and the number of tropical cyclones in any given season. The inset graphic shows a cross-section over Africa of the average AEW kinetic energy (contours) and the correlation (shades).
I then used statistical resampling methods and linear regression to understand how this relationship (i.e. in the graphic on the left, the correlation on the y-axis) varies by the AEW energy (x-axis). The results suggested that in seasons when AEW activity is low, AEW variability is a limiting factor on the formation of TCs but when AEW activity is high, there isn't a corresponding increase in TC formation. In simple terms, if there are few and/or weak AEWs, that is likely to limit TCs forming but once there's enough, there's enough.
Mathematical Analysis of Reanalysis Data

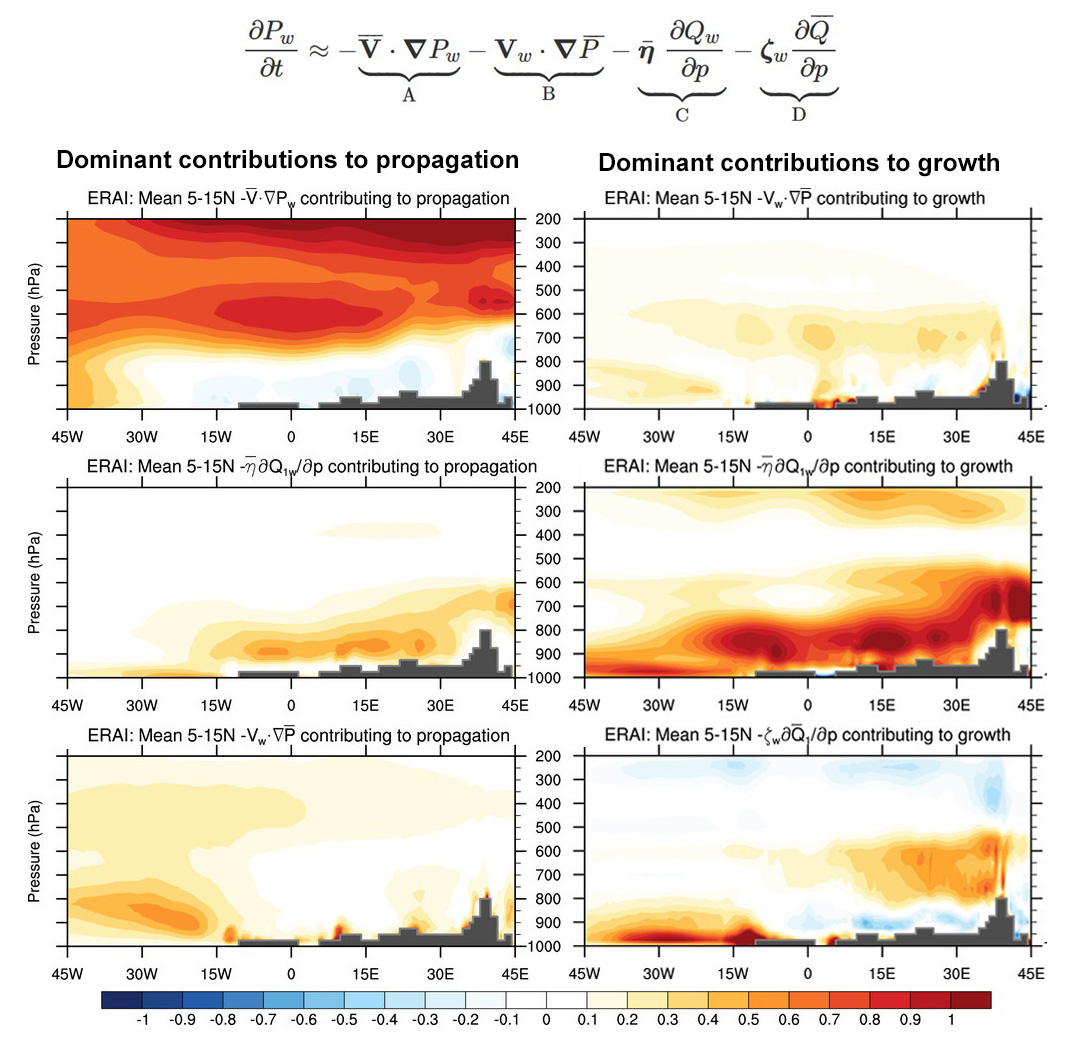
The graphic represents a study examining how African Easterly Waves (AEWs) propagate and grow. To do this, I derived an equation that diagnoses how the potential vorticity (PV; a measure of rotation) of the AEWs changes. Oversimplifying, it separates the contributions of the mean state of the atmosphere (i.e. the jets and temperature gradients) and the heat released by atmospheric convection. Using 30 years of atmospheric reanalysis data, isolating the AEWs by filtering that data, and correlating each of the terms in that equation with the AEW PV tendency and the AEW PV, I diagnosed the contributions to AEW propagation (left column) and growth (right column).
Put very simply, the jet pushes the mid-level AEW along (top left) while convection (bottom 4 right panels) continually grows and propagates the AEWs in the mid and low-levels, especially over Africa. There are relatively minimal contributions to growth by interactions with the mean state (barotropic/baroclinic instability) (top right panel). The latter result is significant because this instability has typically been thought of as the main growth mechanism for AEWs.
Forecast Model Evaluation and Validation

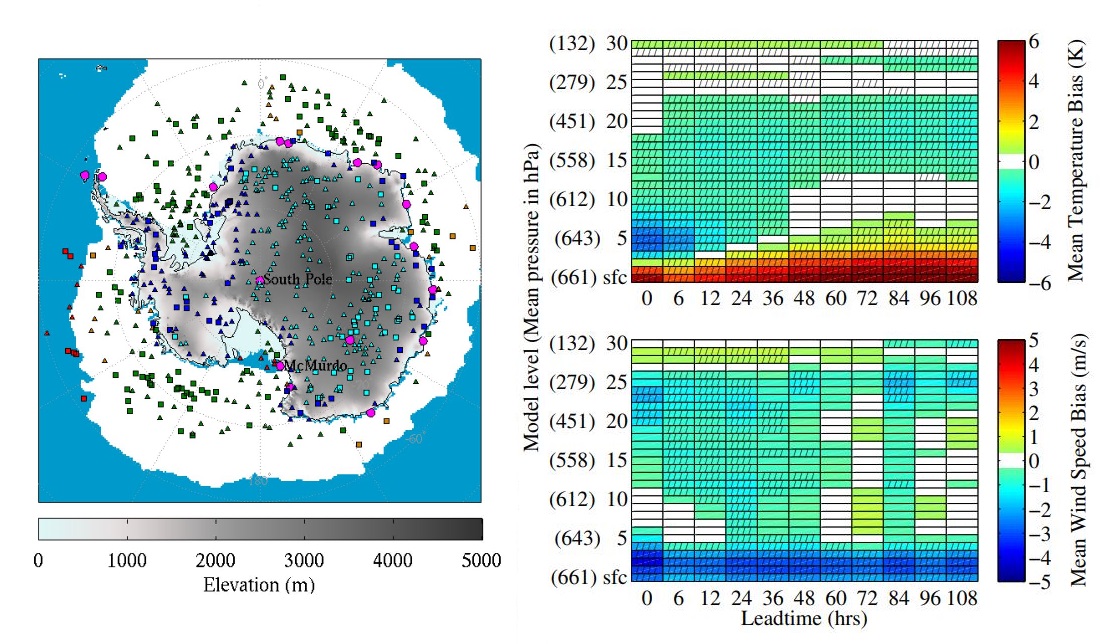
The graphics represent a forecast model validation study where I used a unique data set of soundings to evaluate operational WRF model forecasts over Antarctica. The graphic on the far left shows the various locations over Antarctica where vertical profiles of the atmosphere were observed over a period of a few months.
The other two graphics show the temperature and wind biases as a function of lead time for all soundings over the high plateau of Antarctica. The graphic on top shows that near-surface warm biases get larger as lead time increases while the graphic at the bottom shows a persistent low-level slow wind speed bias. These indicated that the WRF model has an issue representing the near-surface inversion over Antarctica.